Professor Alan Wan, Head of the Department of Management Sciences, argues that combining statistical
models offers advantages in forecasting compared to selection of a single model, that the approach is an
increasingly used analytical tool in applied statistical work, and will likely become a toolkit in the statistician's
repertoire in the future. This article is related to a number of model averaging papers published by Professor
Wan in the Journal of the American Statistical Association, Journal of Econometrics, and Journal of Business
& Economic Statistics.
Scenario
It's decision time: The CEO
could ask: "Which board
member do I trust most?"
Or think, "Everybody has
expertise. I'll listen to them
all." Which approach is
better?
One of Hong Kong's largest
property developers is pitching
towards the millennial market for
its new waterfront project. The
CEO has to decide whether it is
worth building to outstanding
environmental standard, with the
aim of attracting a young "greenminded"
clientele. The decision
depends on a forecast for how big
the millennial market will be in the
coming year. There is an impressive
array of ten professionals on the
board including engineers, financial
experts, marketing professionals,
audit and risk management, etc.
The CEO knows his advisors well
and clearly has greater trust in
some than in others. The ten
advisors give their forecasts, and
he is left with ten numbers. How
should he make a final selection
from these ten numbers? The CEO
could ask himself: "Which board
member do I place the greatest
trust in?" And then take his or
her advice. Another approach
would be for the CEO to say: "All
the advisors have some valuable
expertise to offer, although not
all of the same importance. Some
professions are more significant
in this forecast and should get a higher weighting." Which way of
thinking is the better? Intuitively,
most people would go for the
second method, where a wide
spectrum of professional advice is
taken into consideration. You may
be surprised, however, to hear that
in standard statistics, up to now it
is the first method that has won
out. Let me explain how things are
changing.
What is a model?
With several models to
choose from, researchers
like to know which one is
more consistent with the
data.
Researchers working in different
fields in the hard sciences through
to the social sciences come up with
a variety of ideas in their attempts
to explain various phenomena.
These conjectures are typically
referred to as "models" for the
phenomena of interest. Often
these models sketch out broad
relationships and attributes that
may be relevant, but do not contain
numerical detail and hence are in
this sense incomplete. To flesh out
this detail, researchers use methods
in statistics to estimate their models.
Statistical analysis allows them to
fill in the missing numerical detail.
With several estimated models to
choose from, researchers like to
know which one is more consistent
with the evidence provided by the
data. Fortunately, statistics can also
help them make this decision. Deciding which model is best is
referred to as "model selection".
OBut sometimes the model selection
approach provides no clear winner
with several models being equally
good or equally bad descriptions.
This motivated statisticians to come
up with another approach. Instead
of simply trying to decide which
model ‘fits' data best, they thought
why not construct a new model
that is a weighted average of the
best models? This approach is
referred to as model averaging.
With these two modelling strategies
available, statisticians now have
to decide which to use in different
circumstances.
A further complication is that
statisticians have come up with
many different ideas about how to
go about model selection and how
to implement model averaging.
And also, there are many ideas
about how to determine which of
these various approaches is the best
to use. Statisticians have developed
many different criteria to judge
them by.
Model selection ‒ not so easy
You have many potential
models to choose from,
and different strategies to
arrive upon a final model.
On the face of it, model
selection might appear to be
straightforward. You have a number of competing models
and some criteria to judge which
is best. But the process is not so
easy. You have many potential
models to choose from and many
to discard, and different strategies
to arrive upon a final model.
One strategy is the specification
search approach. In this approach
the researcher uses sequential
hypothesis testing to "pretest"
and eliminate or keep different
variables or specifications and
use the process to arrive at a final
specification.
Typically, statisticians would start
from a single model which they
estimated from data and a simple
hypothesis to test. Is the model
correct or not? Is an estimated
coefficient significant or not?
In this context some very basic
statistical approaches and ideas
about hypothesis testing were
developed to decide if a model
"worked."
That sort of approach is not so
problematic when you test a single
hypothesis. But statisticians later
demonstrated that this approach
doesn't work so well when you
have several models that you
are testing, or have multiple
hypotheses or specifications to be
tested sequentially. Specification
searches by pretesting or statistical
selection criteria, including what
is referred to as "step-wise"
regression, are widely practiced.
In these cases, the standard
statistical tests that you might
use for a single hypothesis were demonstrated to be no longer
valid due to what is referred
to as "pretesting bias", and
adjustments to the hypothesis
testing procedure need to be
made. In applied studies, however,
researchers usually ignore these
issues and report their statistical
results as if no specification search
has been performed. Statisticians
have long been made aware that
ignoring pretesting can result in
very serious consequences.
These problems encountered in
model selection and in testing
hypotheses sequentially resulted in
the development of many different
ideas and approaches.
Much of my earlier work involved
developing and refining some of
these approaches and exploring
the problem of and correcting for
the pretesting bias.
Model averaging offers
advantages
The basic idea of model
averaging is to minimise
risk.
As mentioned, the hypothesis
testing and other selection
frameworks used in the model
selection approach, where many
competing models are discarded,
create problems like pretesting
bias.
One advantage of the model
averaging approach is that there is no discarding of any of
the competing models and no
subsequent specification searches
by hypothesis testing, hence the
problems encountered with model
selection no longer exist.
Model averaging is also a great
approach because frequently no
single model stands out clearly
from the rest, so there are obvious
merits in attempting to average
them.
The basic idea of model averaging,
that is to minimise risk, is used
in many contexts. Individuals,
businesses and governments use
the idea and try to spread their
risk by averaging in various ways.
Individuals do it when investing.
A wise investor avoids putting all
their money into a single business
if possible. Instead they prefer a
diversified portfolio averaging the
returns over several businesses
and asset classes. Also, many
large businesses will attempt to
mitigate risk by diversifying so
that if one part of their business is
doing poorly they can still provide
shareholders with a reasonable
average return. Similarly,
governments will rarely rely on a
single expert when formulating
policy. They frequently canvas a
wide range of opinion and try to
arrive at some sort of consensus or
average position.
Model averaging was a natural
idea for statisticians to adopt
and an increasing number of
researchers are now using the model averaging approach
following the seminal paper
"Frequentist model average
estimators" by the Norwegian
statistician Nils Lid Hjort and
Belgian statistician Gerda
Claeskens published in a 2003
issue of the Journal of the
American Statistical Association.
Since that paper, there has been a
spurt of research activity on model
averaging in the space of just a
few years. A lot of my recent work
has focused in this area.
Research has shown that by
combining competing models
you can generally produce more
accurate predictions than those
obtained from a single model.
This is especially true when the
underlying model or data has a
high "noise" (i.e., unexplained
irregularities) content, making it
difficult for pretesting and model
selection methods to single out
one manifestly preferred model.
Model averaging has been successfully applied in many
disciplines including biomedical
sciences, climatology, ecology,
economics, finance and tourism.
Contrasting the different approaches
Here, I revisit two examples
from one of my earlier papers
published in the Annals of
Tourism Research to illustrate the
dangers of pretesting and model
selection in terms of introducing
bias by underreporting the
variability of estimates and how
model averaging can be used to
overcome these issues and provide
more accurate results.
Correct bounds wider; WALS
more accurate
The first example is based on an
analysis undertaken by the U.S.
Department of Agriculture (USDA)
in 2005 that investigated the
degree to which recreation and
tourism development influence
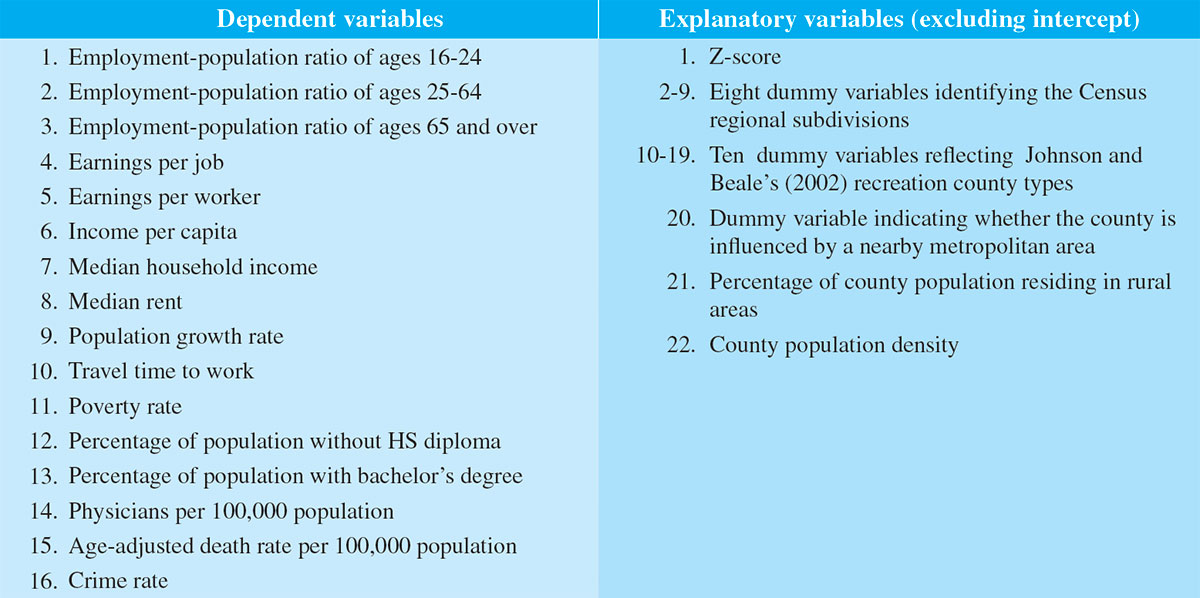
various socioeconomic indicators including earnings per job, income
per capita levels, death rates and
others, in some 311 rural US
counties in the year 2000.
Researchers from the USDA
estimated a sequence of multiple
regression models using a
distinct socioeconomic indicator
as their dependent variable.
Their key explanatory variable
was a Z-score which measures
the county's dependency
on recreation and tourism,
and covers tourism-related
employment and income shares
of the local economy, as well as
the share of total county homes
dependent on recreational
use. The higher the Z-score the
more dependent a county is
on recreation and tourism. The
USDA was primarily interested in
the coefficient estimate of the
Z-score. The other explanatory
variables are listed in Table 1.
Table 1: List of variables
Methods and Results
I used their study to analyse the
effect of pretesting and highlight
the merits of model averaging as
an alternative to model selection.
To illustrate the effects of
pretesting I used a popular
stepwise regression procedure.
This kind of model selection
approach is so common that
automated routines for stepwise
selection are available in most
statistical software packages. To
produce the model averaging
results, I used a technique known
as weighted average least squares
(WALS), introduced by the
renowned Dutch econometrician
Jan Magnus.
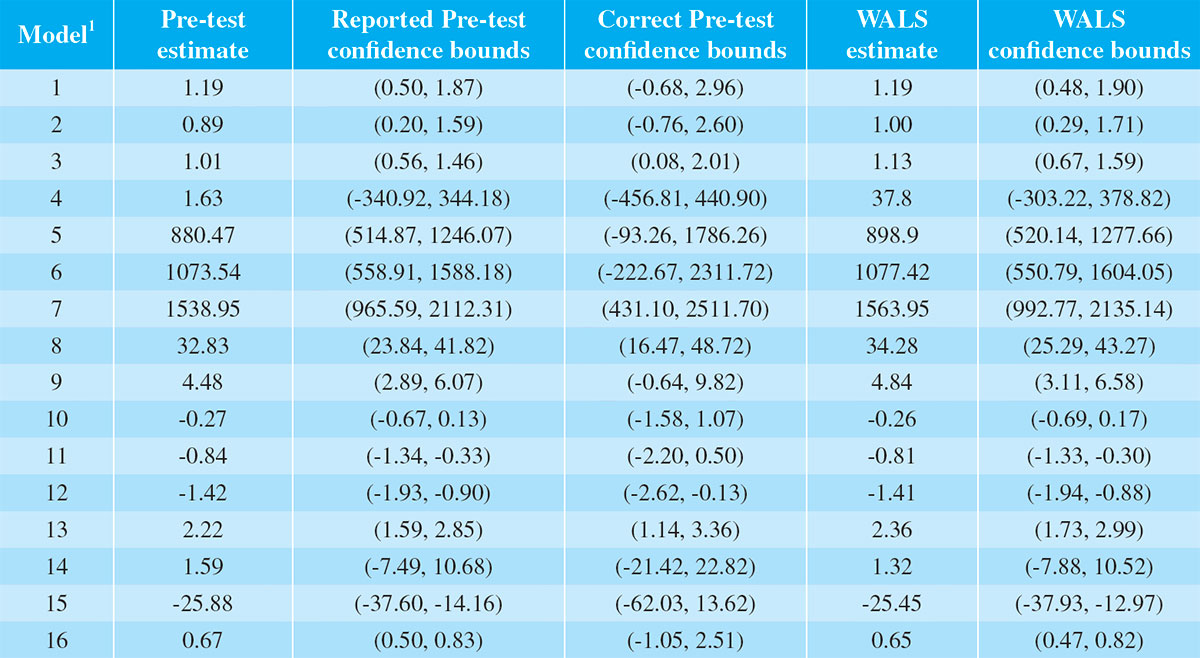
Estimates using both approaches,
for the coefficient of interest, the
Z-score, are in Table 2.
Table 2: Estimates of coefficient of Z-score in each regression and confidence bounds
1. Models 1-16 are based on, respectively, dependent variables 1-16 listed in Table 1.
Column 2 of Table 2 provides the
estimates based on the model
selected by stepwise selection for
each regression. The third column
provides the 95% confidence
bounds for those coefficients
when pretesting has not been
taken into account. These are
the confidence bounds usually
reported in applied work when the
researcher assumes (erroneously)
that the model has been chosen a
priori and not as a consequence of
model selection. The confidence
bounds reported in Column 4, on
the other hand, are the correct
95% confidence bounds paying
due attention to consequent
effect of stepwise selection on the
variability of the estimates.
In all cases the commonly reported
confidence bounds that ignored
pretesting underreported the true
confidence bounds. As this example illustrates, the difference between
the reported and the correct
confidence bounds can be very
large. In the worst case, the true
confidence bounds were almost 11
times as wide as the bounds that
ignore pretesting; on average they
are about three times as wide.
The WALS coefficient estimates
and the 95% confidence bounds
appear in Columns 5 and 6
respectively. In all cases the WALS
and pretest coefficient estimates
have the same sign and similar
magnitudes. However, without
exception the WALS estimates
produced tighter confidence
bounds than the (true) pretest
confidence bounds. On average,
the WALS confidence bounds are
43% the width of the correct
pretest confidence bounds; thus
notable reductions in estimator
variability are achievable with the WALS approach. This is to be
expected because model averaging
usually leads to estimates that are
of superior precision than those
achieved by selecting a single
model, as has been demonstrated
in the theoretical literature. While
these results are, of course,
specific to the data example
considered here, the evidence
does provide an indication of
the performance gains that are
possible.
Model averaging – better
prediction
The second example illustrates the
benefits of using model averaging
to improve forecasting accuracy
when using common time series
models.
To illustrate these advantages I
used data on the number of longstay
visitor arrivals in Barbados
between 1956 and 1992 from a
paper published in the Annals of
Tourism Research. In that paper
the author, Gerald Dharmaratne,
estimated two ARIMA models
using the data up to 1987 and
then used the models to forecast
the remaining years, and evaluated
the accuracy of the resulting
forecasts.
Dharmaratne used a model selection approach to choose
his preferred forecasting model.
The criterion he used was the
AIC score, where a lower score
suggests a model should provide
better forecasts. For the less
complex ARIMA(2,1,1) model, the
AIC score is only slightly better.
Nevertheless, under the model
selection approach this is the
preferred model for forecasting.
And as it turned out, this model's
forecasting performance is
significantly better.
My study demonstrated that when
there is no predominant model to
call on, forecast accuracy could
be further improved by combining
results from the two models. I
applied model averaging using a
smoothed AIC weighting scheme
to generate forecasts for those
same remaining years.
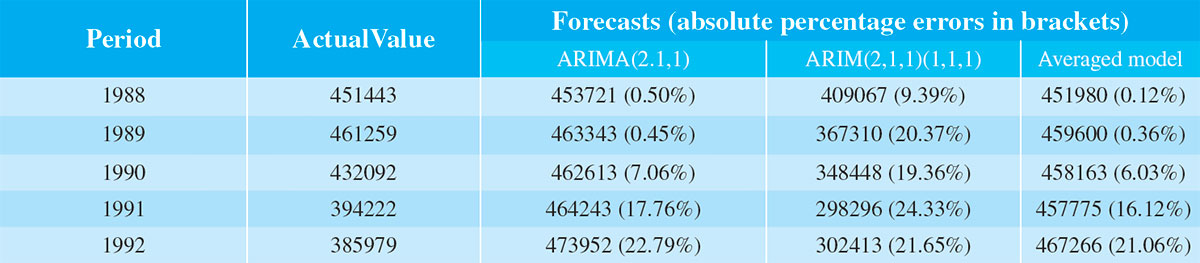
Table 3: Forecast Comparisons
Table 3 presents the forecasts and
a measure of their accuracy —
their absolute percentage errors.
The forecast performance of the
second model, the ARIMA(2,1,1)
(1,1,1)5, is rather poor. Except for
1992 its predictions are always
worse, usually by a large margin.
In comparison, the forecast
performance of the averaged
model is quite remarkable. In
all cases the forecasts are closer to the true values than those
obtained from the better of the
two Dharmaratne models.
My averaged model has a mean
absolute percentage forecast
error of less than 9%, while the
corresponding figures for the
Dharmaratne models are almost
10% for the more accurate model
and almost 20% for the other
model.
Conclusion
The specific techniques I used in
the preceding examples are just
two of many model averaging
techniques from the literature now
available for researchers. Model
averaging has been an increasingly
used analytical tool in a lot of
applied work. Undoubtedly,
this approach will be used more
extensively in the future.
Professor Alan Wan
Head
Department of Management Sciences